Perspectives on Blancco’s State of Mobile Device Report (iOS Android)
Recently, Blancco published a report on the performance and health of iPhones and Android smartphones. “The State of Mobile Device Performance and Health: Q4 2016.” It created quite a stir at first.

A key finding was that iPhones are less reliable than Android devices. The report intrigued me, so I asked for a copy of the report and looked into the findings. Here’s what I found.
The first thing I wanted to know about was the background of Blancco, a company I’d never heard of. I found this at Reuters.
Blancco Technology Group Plc, formerly Regenersis Plc, is a provider of mobile device diagnostics and secure data erasure solutions. The Company’s segments include Erasure and Diagnostics…. The Diagnostic segment includes Xcaliber Technologies, a smartphone diagnostics software business.
Defining Terms
Having looked into the company for background, I next looked at the 19 page report they kindly sent. A term that popped right out was the use of the phrase “failure rate.” When I heard that term, the notion of a hardware failure only was on my mind. In fact, however, Blancco defines the term in a more general way.
Failure rate refers to devices that had excessive performance issues that could not be resolved.
This refers to some unintended behavior that the customer could not fix on their own. It could be a headphone jack that acted up, a rapidly dissipating battery or even an app crash. We don’t normally think of a crash by an app as Apple’s bailiwick, but in this case it’s a whole system approach.
On this basis, the reports starts out with its first finding.
Our data suggests that it’s more reliable to own Android devices than iPhones, which have been weighed down by a multitude of performance issues and high failure rates in the last year. Although iOS devices haven’t always had a higher failure rate than their Android counterparts, the failure rate has steadily increased quarter over quarter for the last year until it finally stabilized in Q4 2016.
Right away, I wanted to know more about “our data.” Was it a survey? Was it a random sampling of the hardware? I asked Blancco about that. They responded.
The information contained in this report is based on internal data collected from millions of iOS and Android mobile devices that were brought into mobile carriers and device manufacturers for diagnostics testing in North America, Europe and Asia over the course of five quarters, including Q4 2015, Q1 2016, Q2 2016, Q3 2016 and Q4 2016. The diagnostics tests were performed using the Blancco Mobile Diagnostics platform.
So then my next question was this: This report looks only at units that were brought into carriers and manufacturers for failure analysis, remembering that failure could mean that, say, the Facebook app that continued to crash.
Apple sells more than 200 million iPhones each year these days. So even if several million iPhones were analyzed, that represents only about a percent of the annual sales and much less for the installed base. The other, perhaps, 99 percent didn’t have issues. Or didn’t complain.
With all the above in mind, we can better undestand the first chart, Figure 1, and understand the large numbers presented.
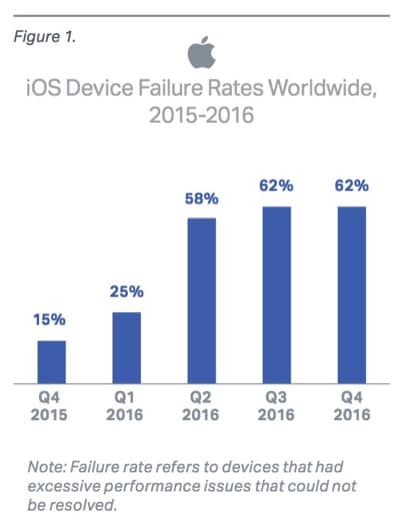
Blancco Figure 1.
The report explains:
In Q4 2015, for example, iOS devices had an overall failure rate of 15 percent. This was considerably lower than Android devices, which had an 85 percent failure rate during that period. But as each quarter has passed, the iOS failure rate has increased steadily – from 15 percent in Q4 2015 to 25 percent in Q1 2016 to 58 percent in Q2 2016 to 62 percent in Q3 2016. Now in Q4 2016, iOS devices once again lost the performance battle with more performance issues and higher failure rates worldwide (62 percent) than Android devices (47 percent).
The iPhone 6 is singled out as one model that experienced more performance failures than other models.
One possible explanation for why the iPhone 6 may have struggled with more performance issues and failures than other models over the last year could be Apple’s release of multiple software updates – iOS 9.3.1 in April 2016, iOS 9.3.2 in May 2016, iOS 10 in September 2016 and iOS 10.2 in December 2016. Following all of these software updates, many iPhone and iPad users began to experience problems on their devices, such as faster battery drain, ‘bricking,’ random crashes, poor sound quality when taking Bluetooth calls, crashing apps and WiFi connectivity problems, just to name a few.
Next page: Perspectives & the Good News
This year’s iPhone 7 Pluses (Image credit: Apple)
Perspectives
Here at The Mac Observer we’ve covered events such as those described. The thing to remember, however, is that:
- Not every failure occurs on every iPhone. Issues, especially those relating to software, tend to be sporadic, are rare, and often go unexplained. User behavior and habits are often pointed to in the analysis.
- These failures have to be put into context as 1) a percentage of the whole population and 2) relative to each other over time.
In that regard, looking at what is to be sure, a sample, and comparing across models is valuable. For example, using consistent standards for “failures” which iPhones fare the worst? That’s a helpful question. Here’s what the report found.
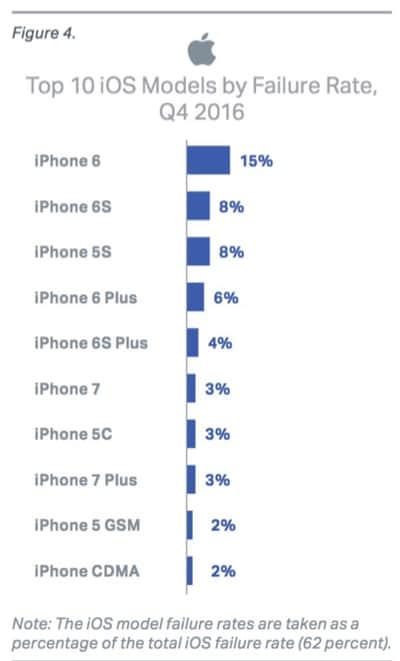
Blancco’s Figure 4.
The report goes on to look at Android phones and finds that, like the iPhone 7, failure rates went down. I won’t go into the Android analysis here; you can read the report for yourself. But it’s of interest to note that for a block in time, the iPhone 6 era, these failure rates were going up with iOS devices and down with Android. There’s no way to predict if that trend will continue.
Back to the iPhone/iOS devices. Aside from frequently crashing apps after a major software update, customers frequently reported problems with:
- Apple’s ear pods fail to work for a phone call, requiring a restart of the call.
- Spotty Bluetooth connectivity
- Unexplained battery depletion after an OS update with attendant battery overheating.
The Good News
The thing to remember, amongst all the numbers and charts, is that any electronic device is going to have minor issues. The question to ask is how pervasive are the problems and how unhappy are the customers as a whole? For example, the iPhone consistently scores very high in J.D. Power satisfaction studies.
Finally, when an identifiable problem crops up, as with the loose lens in the iPhone 6, it gets fixed under warranty—or AppleCare+.
I came away from this report feeling that Blancco had done a pretty good job cataloging the kinds of problems that customers are having when they bring their smartphone in for some problem. And they did a good job comparing the problems across several generations of iPhone models. And against Android for a short period of time.
However, one still has to understand what’s meant by “failure rate” and then dig pretty deeply with an analysis of the analysis to put it all into perspective.
0 Response to "Perspectives on Blancco’s State of Mobile Device Report (iOS Android)"
Post a Comment